PERFORMANCE INDICATORS FOR THE CURRENT AND PAST FIVE FINANCIAL YEARS
| Profitability Ratios | Unit | 2024 | 2023 | 2022 | 2021 | 2020 | 2019 |
|---|---|---|---|---|---|---|---|
| Gross profit ratio | (%) | 8.1 | 2.4 | 19.9 | 19.8 | 10.3 | 11.4 |
| Operating profit margin to sales | (%) | 8.0 | 1.1 | 16.7 | 18.7 | 8.1 | 9.0 |
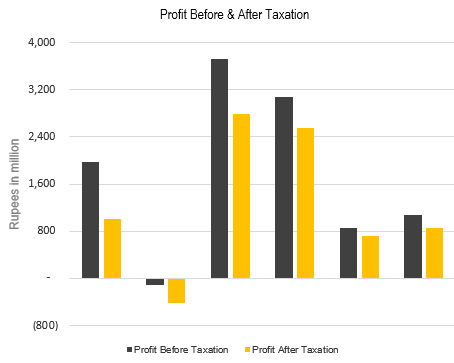
| Net profit margin to sales (net) | (%) | 3.4 | -2.2 | 11.9 | 14.7 | 5.6 | 6.1 |
| Return on average equity | (%) | 8.8 | -3.7 | 26.9 | 32.2 | 11.3 | 14.7 |
| Return on capital employed | (%) | 15.7 | 1.4 | 26.4 | 27.4 | 11.4 | 14.7 |
| Liquidity Ratios | Unit | 2024 | 2023 | 2022 | 2021 | 2020 | 2019 |
| Current ratio | (times) | 2.6 | 2.5 | 2.9 | 2.8 | 1.9 | 1.8 |
| Quick ratio | (times) | 1.4 | 1.1 | 1.4 | 1.8 | 0.9 | 0.8 |
| Activity / Turnover Ratios | Unit | 2024 | 2023 | 2022 | 2021 | 2020 | 2019 |
| Debtors turnover ratio | (times) | 10.3 | 6.7 | 11.6 | 14.4 | 13.7 | 17 |
| No. of days in receivables / Average collection period | (days) | 35.6 | 54.7 | 31.4 | 25.4 | 26.7 | 21.5 |
| Inventory turnover ratio | (times) | 4.6 | 3.1 | 4 | 4 | 3.4 | 4.3 |
| No. of days in inventory | (days) | 78.6 | 118.8 | 90.9 | 90.7 | 107.4 | 85.5 |
| Creditors turnover ratio | (times) | 5.8 | 4.5 | 6.7 | 4.4 | 4.3 | 5.5 |
| No. of days in creditors / Average payment period | (days) | 63.3 | 81.6 | 54.6 | 82.3 | 85 | 66.4 |
| Total assets turnover | (times) | 1.4 | 0.9 | 1.3 | 1.2 | 1 | 1.2 |
| Investment / Market Ratios | Unit | 2024 | 2023 | 2022 | 2021 | 2020 | 2019 |
| Earnings per share | (Rs.) | 20.6 | -8.4 | 62.9 | 63.4 | 19.6 | 23.4 |
| Price earnings ratio | (times) | 6.5 | -13.0 | 3.4 | 3.8 | 8.4 | 5.3 |
| Cash Dividend/Bonus shares | (Rs.) | 5.0 | 1.0 | 4.0 | 10.0 | 4.0 | 5.0 |
| Stock dividend/ Bonus shares | (%) | – | 10.0 | – | 10 | 10 | – |
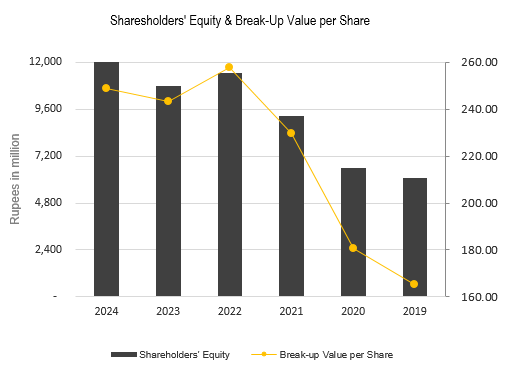
| Break-up value per share | (Rs.) | 248.6 | 243.3 | 257.9 | 229.8 | 180.4 | 165.5 |
| Market value per share | Unit | 2024 | 2023 | 2022 | 2021 | 2020 | 2019 |
| Closing | (Rs.) | 133.2 | 110.1 | 215 | 239.9 | 165 | 124.8 |
| High | (Rs.) | 157.3 | 215.0 | 268 | 254 | 185 | 157 |
| Low | (Rs.) | 88 | 84.8 | 201.2 | 143 | 108 | 113 |
| Capital Structure Ratios | Unit | 2024 | 2023 | 2022 | 2021 | 2020 | 2019 |
| Debt equity ratio | 25:75 | 23:77 | 22:78 | 27:73 | 29:71 | 33:67 | |
| Total liabilities to total assets | (%) | 46.89 | 49.01 | 44.54 | 41.08 | 49.15 | 48.53 |